Features
See the real cost, all the way down.
Open any product and follow its supply chain, activity by activity, until it touches raw nature. Read its impact under every method that matters, reuse what others have already built, and control exactly who can see and change your data.
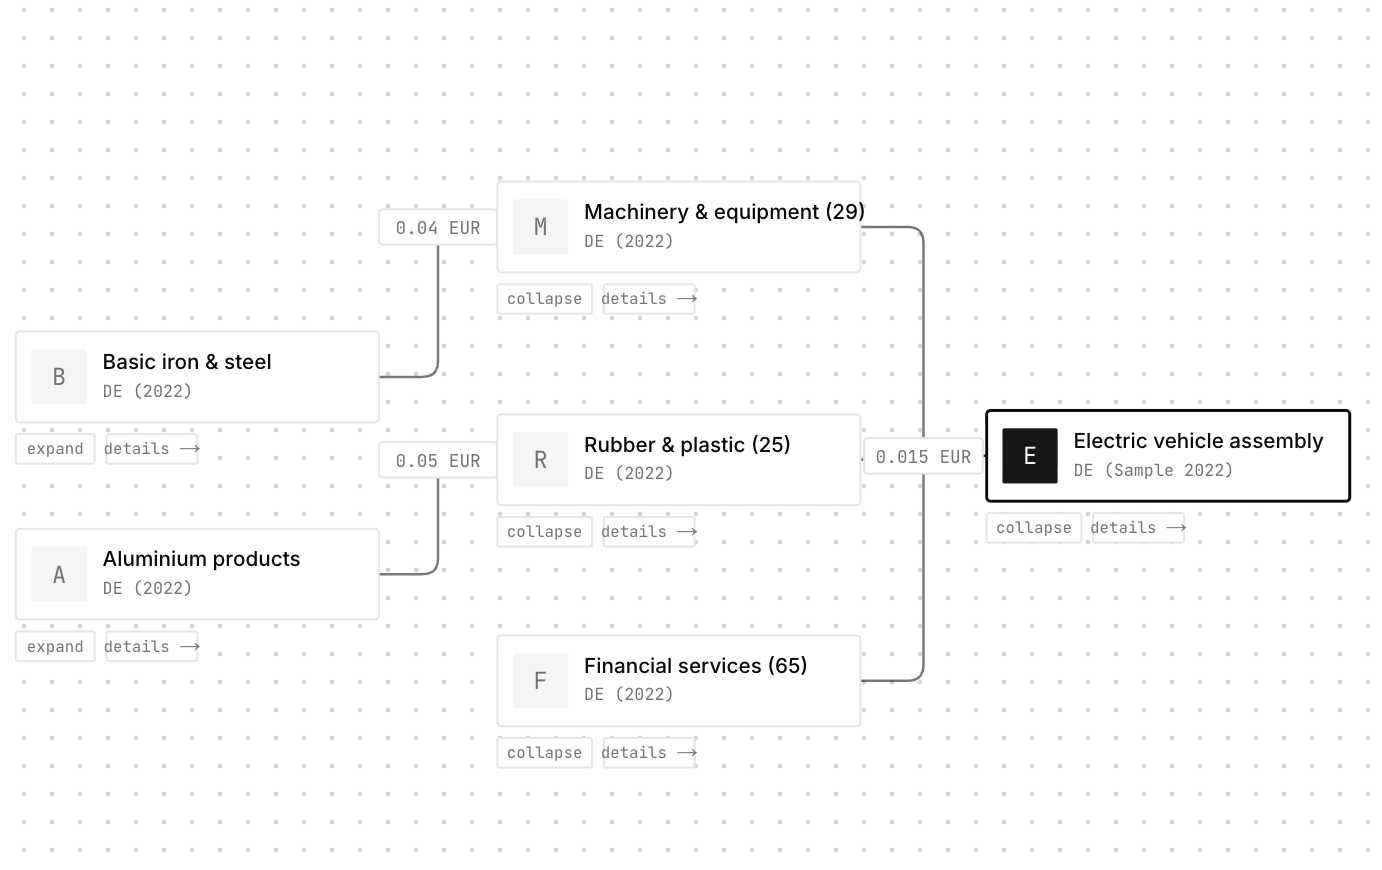
Compare
Every method. Every horizon. Every revision.
A single activity, characterised under every method that matters at once, and diffed against its own history so you can see what changed and why.
Read more →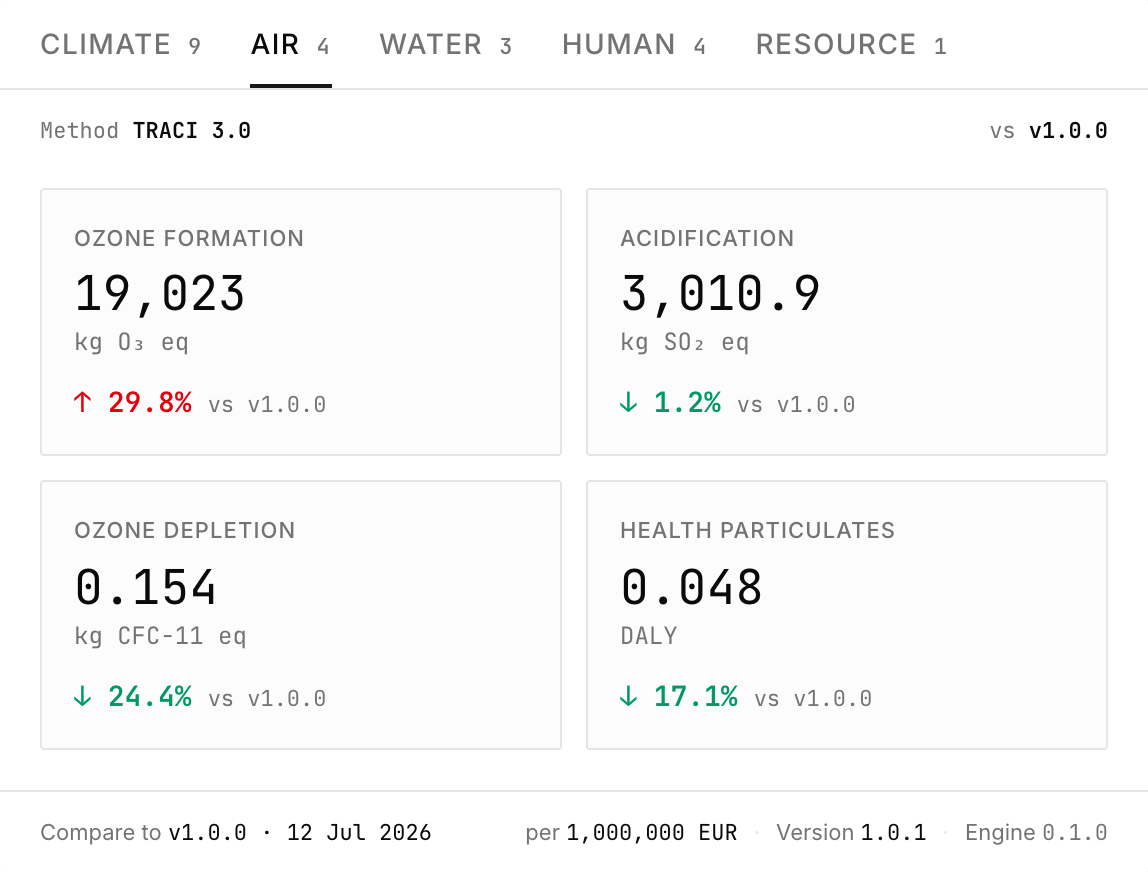
Reuse
Reuse what others have already modelled.
Public activities are searchable and readable by every signed-in user. A growing library of processes and supply chains you drop straight into your own model instead of rebuilding them.
Read more →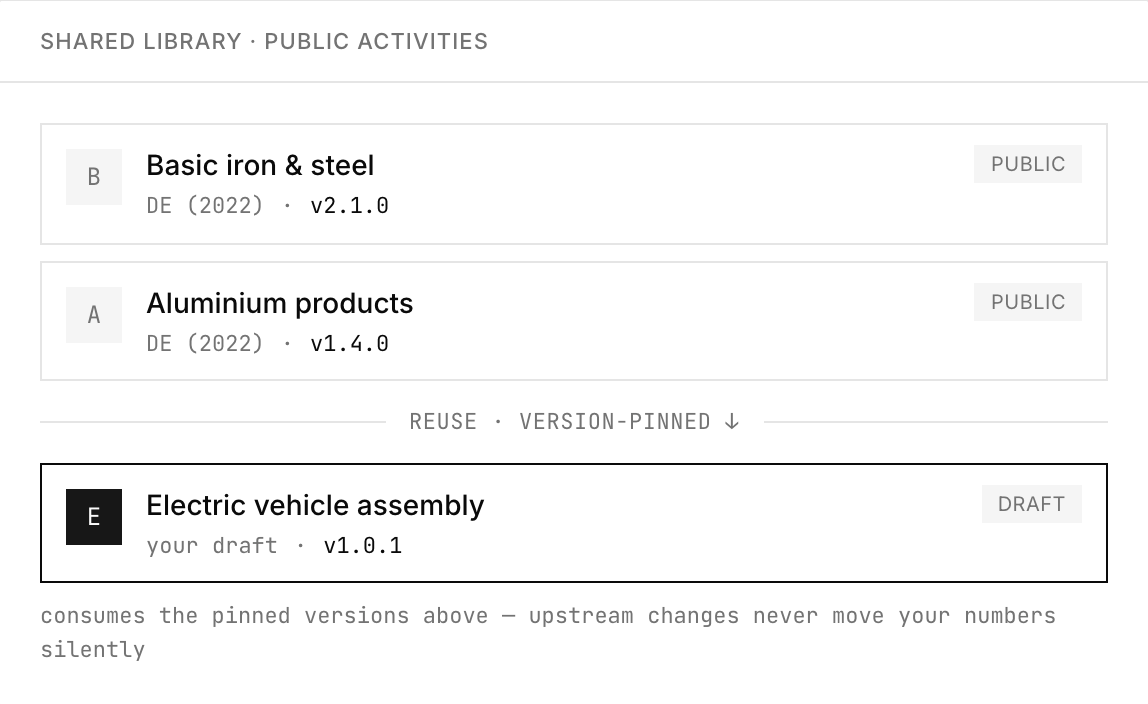
Report
Turn the graph into a lifecycle report.
Sort activities into groups — production, use, end of life, or any axis you define — and read the impact broken down the way you need to report it.
Read more →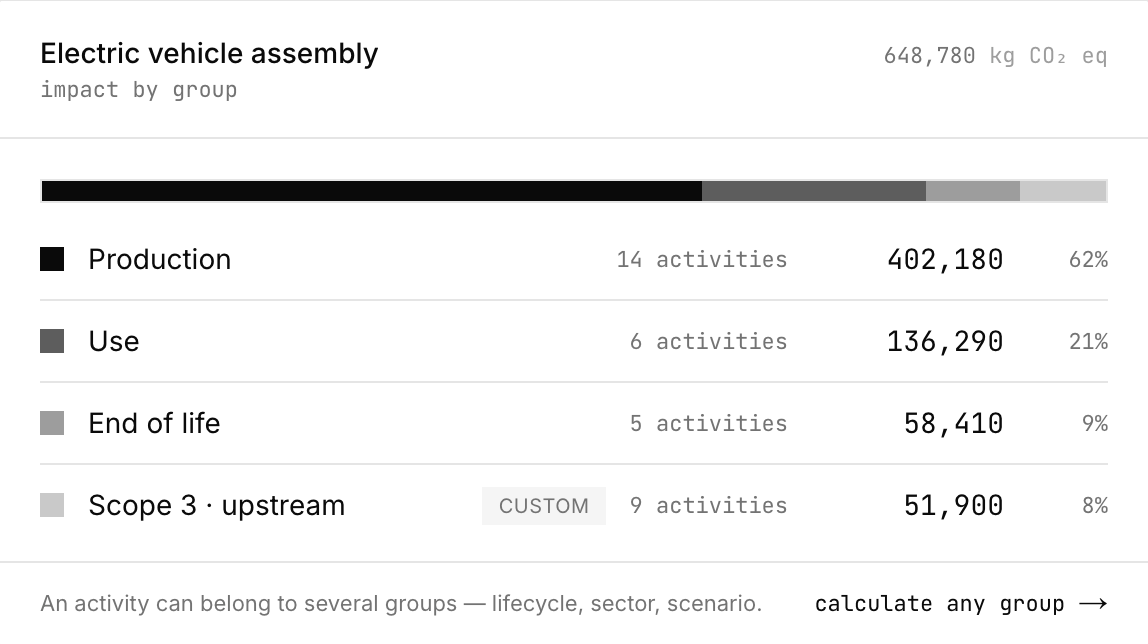
Govern
Decide who sees and changes what.
Fine-grained access control at both the organisation and the individual activity, so data is shared exactly as wide as you want, and no wider.
Read more →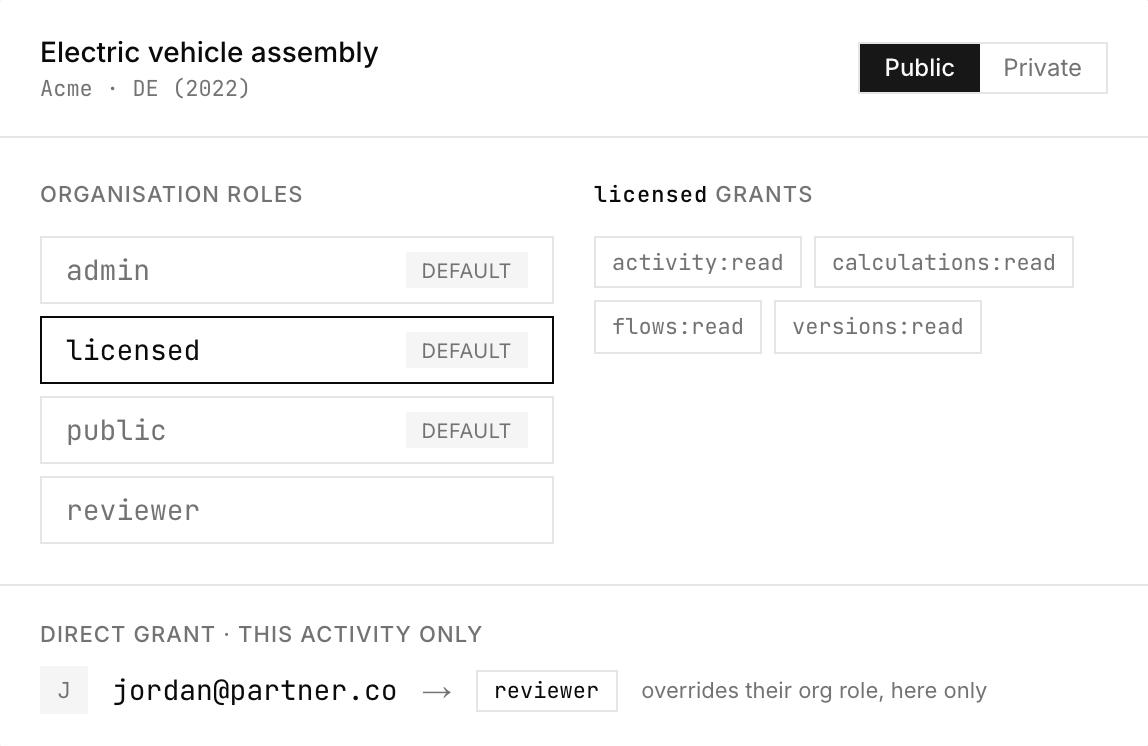
No false precision, ever
Numbers you can defend.
Every result carries an accuracy grade, propagated up the whole chain, so the headline number inherits the credibility of its weakest input. Where data is missing or generic, the platform shows a low grade rather than a confident wrong number.
The fit of every input
Source
Who produced the data and whether their work is peer-reviewed. Read off the producing organisation, never claimed.
Geography
How close the producer’s region is to the activity’s: same, one level up, global, or somewhere else entirely.
Temporal
The producer’s reference year against the activity’s. A figure from the same year scores higher than one a decade old.
The result as a whole
Completeness
A missing upstream link, a cycle, a unit mismatch or a factor with no fit for the region marks the result truncated. Nothing is dropped silently.
Reasons
Every score names what produced it, so “17 inputs: 3 exact, 6 parent, 8 global” is on the result, not just a number.
Propagation
A well-matched input drawn from a badly sourced upstream cannot score as if the upstream were sound, and the loss is traceable to the flow that introduced it.
Start free
Follow your first supply chain to the base.
Sign-up is open. The full public dataset, every supply chain expandable to the base, and an accuracy grade on every number.
Already have an account? Sign in